CI Monitor
See also: Continuous Integration
What it is
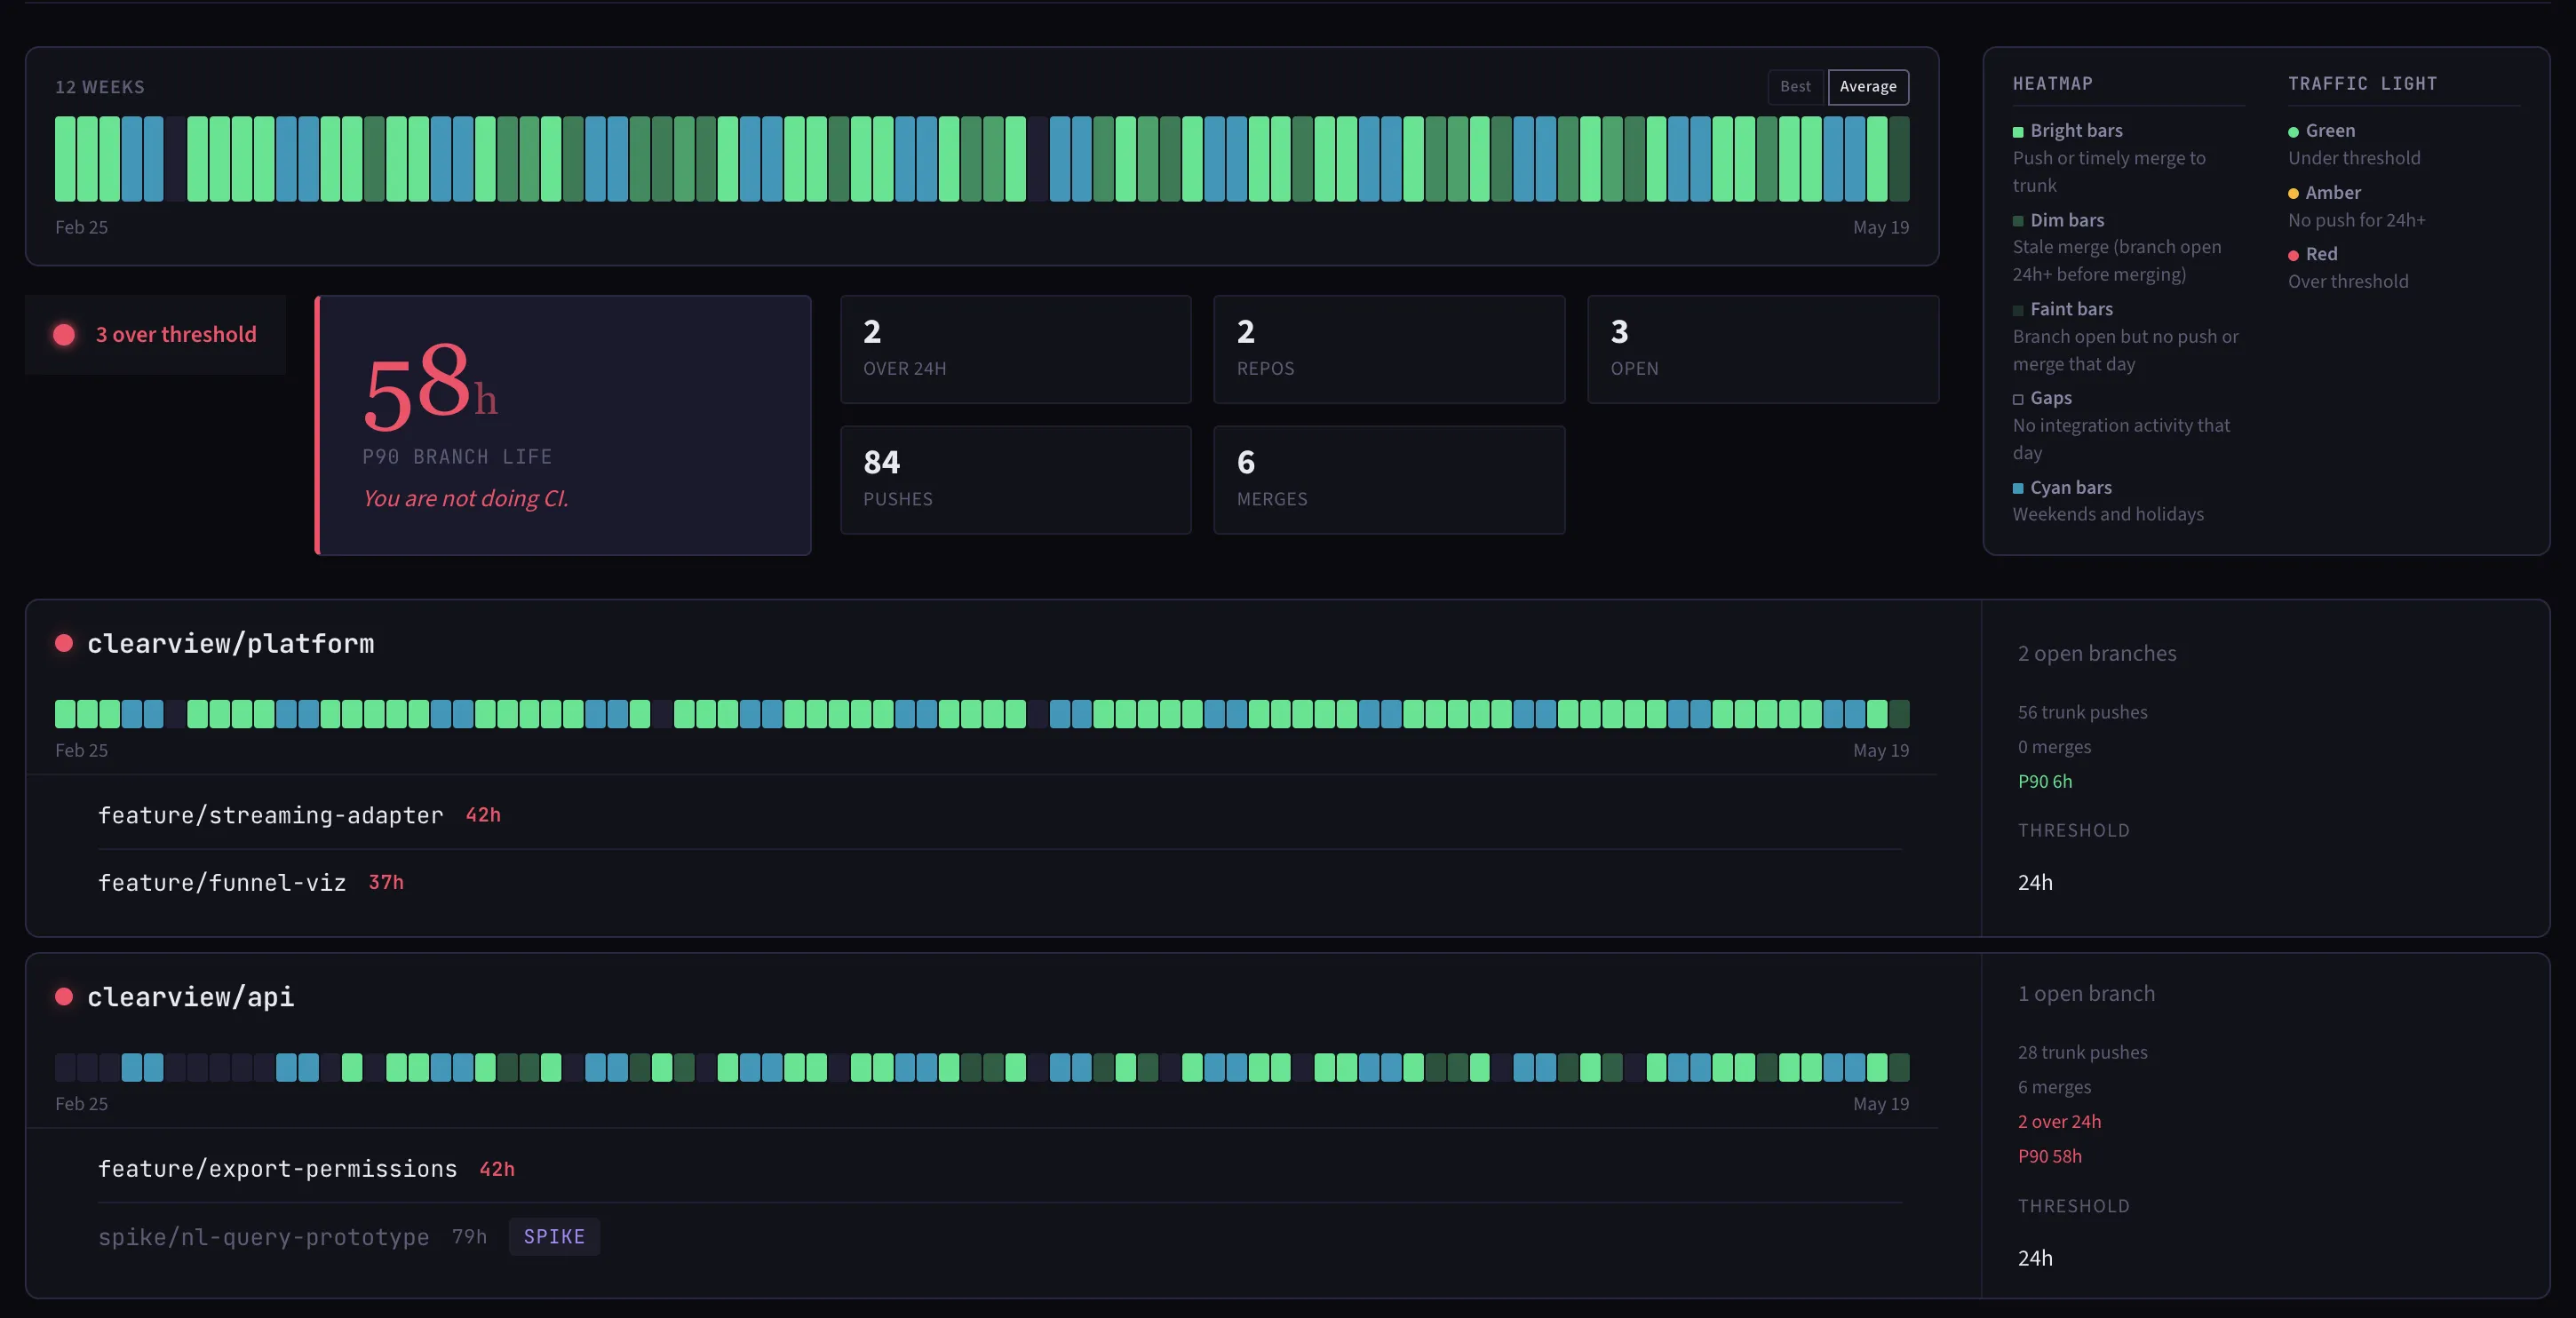
A free GitHub app that tells you whether your team is actually doing continuous integration. It tracks pushes to trunk and branch lifetimes, gives each repo a traffic light, and shows a 12-week trend.
Why it exists
Most teams that say they do continuous integration are running a build server on feature branches and calling it CI. The monitor makes the truth visible: are branches actually short-lived, or are they quietly living for days?
The traffic light shows whether your branches are merging within a day.
The traffic light
Three states, per repo and overall:
- Green
- All open branches are within their threshold, and trunk received a push within 24 business hours.
- Amber
- No branches are over threshold, but trunk has not received a push in 24+ business hours. The repo is silent. Work may be happening locally, or it may not be happening at all.
- Red
- At least one open branch has exceeded its threshold.
The overall status is the worst state across all watched repos. One red repo makes the whole thing red.
Business hours
Branch age is counted in business hours only. A branch opened Friday at 5pm will still be green on Monday morning.
Business hours means all hours on Monday through Friday (24 hours per weekday). Weekend days do not count towards branch age. The team's timezone setting determines when weekdays begin and end.
Thresholds
The default threshold is 24 business hours (one full weekday). Each repo can be tightened to 16 or 8 hours for teams that want to integrate faster.
The maximum threshold is 24 hours.
Summary metrics
The dashboard shows rolling metrics across all watched repos:
- Trunk pushes
- Direct pushes to the default branch (main/master). These are true CI integrations.
- Merges
- Branch merges via pull request.
- Over 24h (30d)
- Count of branches merged in the last 30 days that took longer than 24 business hours to merge. Green at zero. Cannot be diluted by adding quick branches.
- P90 branch (30d)
- 90th percentile merge time across all branches merged in the last 30 days, pooled across all watched repos. If 10% or more of your branches take longer than 24 hours, the P90 will show it. Green at 24 hours or under.
Both branch metrics use a 30-day window so the team sees improvement quickly when they start merging faster. Branches marked as spikes that were later merged are excluded from both metrics.
Spikes
A branch can be marked as a spike from the monitor. This removes it from the red/green calculation. The branch stays visible in the list with a "spike" label.
Spikes are for throwaway experiments you know you will discard. If a spike branch is later merged via pull request, the monitor flags it with a "was spike" warning. This is visible to the whole team.
Abandoned branches
When a branch is deleted without merging, the monitor marks it as abandoned. Abandoned branches are shown on the dashboard for visibility but do not affect the traffic light. A deleted branch is resolved.
The heatmap
Each repo and the overall dashboard show a 12-week integration heatmap. Each bar represents one day. Bright bars mean a push or timely merge happened. Gaps mean no integration activity, which may indicate batching or non-coding work. Dim bars mean a branch was open longer than 24 hours before merging.
Weekend bars display in cyan. Idle weekends have no negative implication.
Best vs Average
When monitoring multiple repos, the overall heatmap combines their signals. A toggle in the top-right corner of the heatmap lets the team choose how:
- Average
- Each day shows the mean intensity across all active repos. An idle repo dims the overall bar, making gaps across the portfolio visible. This is the default.
- Best
- Each day shows the brightest repo. If any repo is integrating, the overall bar reflects it. An idle repo does not drag down active ones.
Individual repo bars always show their own activity regardless of this setting.
The dashboard also shows a CI streak count (consecutive weekdays with integration activity) and active days count (weekdays with any integration activity in the 12-week window).
How to connect
Install Mainline CI Monitor from the GitHub Marketplace, then:
- Visit the Monitor page from your team navigation.
- Click "Connect GitHub" to link your installation.
- Select which organization to connect (if the app is installed on multiple orgs).
- Choose which repos to watch.
- The monitor backfills existing open branches on import, then tracks new ones via webhooks.
What we never see
The GitHub App requests pull_requests:read and metadata:read only.
It does not request contents:read. It never sees source code, file contents,
diffs, commit messages, PR descriptions, or issue content.
Repo names and branch names are encrypted at rest. If our database were compromised, attackers would see ciphertext, not repo names that reveal product strategy.
You can game this monitor
- Delete branches without merging. The monitor marks them as abandoned. The deletion is visible to the team.
- Work locally and push directly to trunk. The monitor cannot see local branches. If you are integrating to trunk multiple times a day, you are doing CI whether the monitor sees it or not. If you stop pushing for 24+ business hours, the monitor goes amber.
- Rename a branch to reset the clock. A rename gives you a fresh timer, but the effort spent resetting the clock could have been spent integrating.
- Mark everything as a spike. Spikes are visible to the whole team. If a spike is later merged, the monitor flags it with a warning.
- Create fast branches to dilute the average. The monitor uses "over 24h" count and P90 instead of an average. Quick branches do not reduce these numbers.
The monitor is a team tool. It works best when the team trusts the signal.
What it does not do
- Per-developer metrics
- Pull request analysis
- Deploy tracking (see Flow)
- DORA metrics
- Email or Slack notifications
- Configurable business hours
- Exclusion patterns
- Public holiday calendars beyond the supported regions
These are intentional omissions.